
About Income Statement Chart Excel Template with automated visualisation
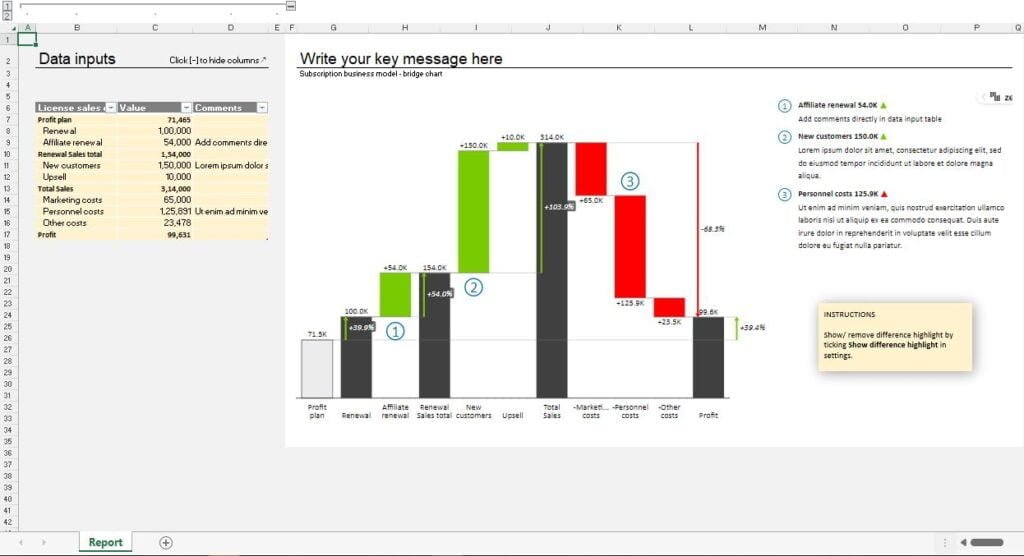
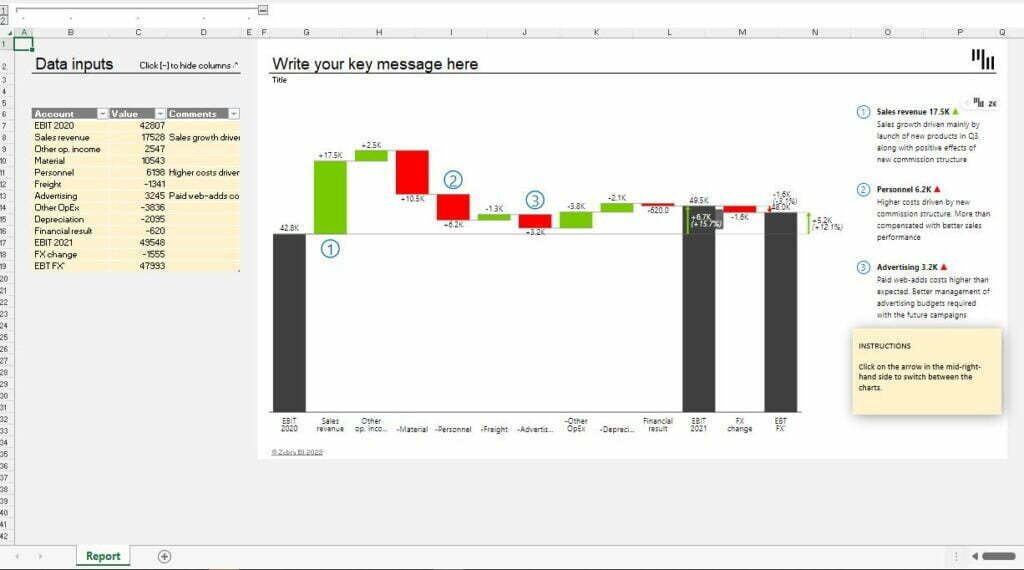
An Income Statement Chart is a type of financial chart that summarizes a company's revenue, expenses, and profits over a specific period of time. This chart is created in Microsoft Excel using a data analysis template. The template includes pre-formatted charts and tables that make it easy for users to input their financial data and create a visual representation of their income statement.
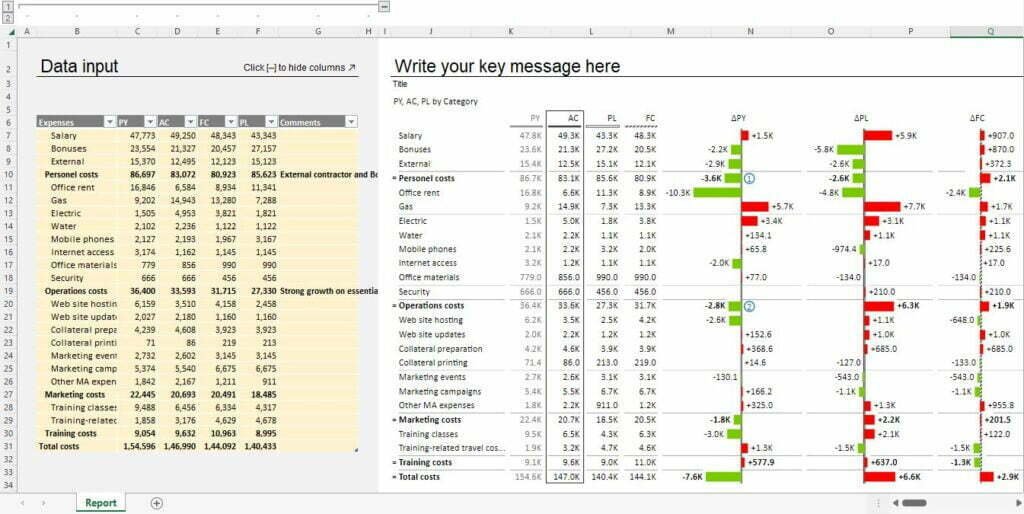
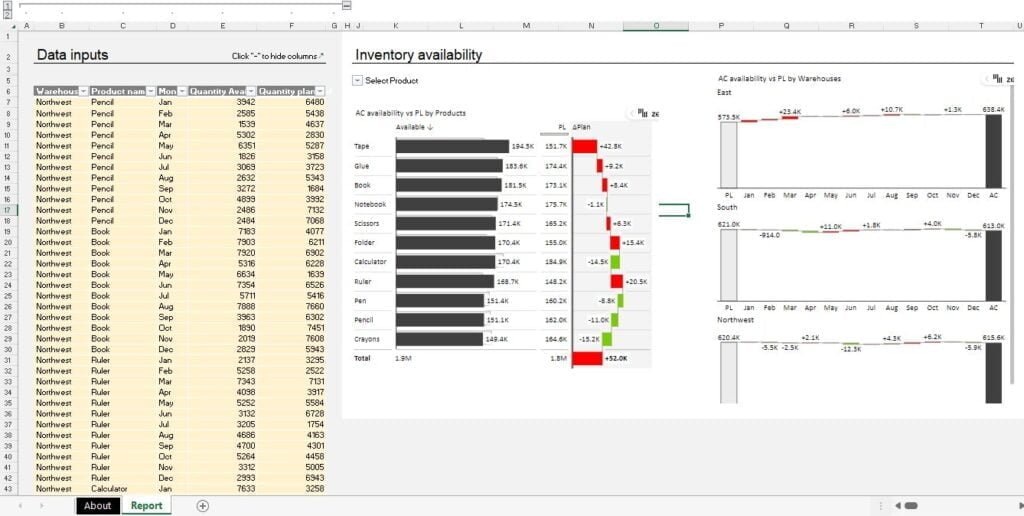
The template starts with a table that lists the company's revenue, expenses, and profits. This table is usually followed by a bar or line chart that visually represents the data. The chart can be customized to display the data in different ways, such as by quarter, by month, or by year.
Who can use this template?
The Income Statement Chart template is useful for business owners, finance professionals, and investors who want to track the financial performance of a company over time. It helps to identify trends and patterns in a company's financial data and provides a quick and easy way to see how a company is performing financially.
This template can be downloaded after creating an account in template supper, depending on the source. It is available in Microsoft Excel format and can be easily edited to meet the user's specific needs. The template can also be used as a starting point for creating a more detailed financial analysis of a company's performance.
Benefits of using this editable Income Statement Chart excel template
There are several benefits to using editable Income Statement Chart Excel templates for data analysis:- Time-saving: Creating templates from scratch can be time-consuming and tedious. Using pre-designed templates can save you a significant amount of time and effort, allowing you to focus on analyzing your data.
- Professional design: Our templates are designed by professional designers who understand the importance of functionality and aesthetics. This ensures that your data is presented in a clear and professional manner.
- Customizable: All of our templates are completely editable, meaning you can customize them to fit your specific needs. This allows you to tailor the template to your unique requirements and make it more effective for your specific use case.
- Business intelligence tools: Our templates are prepared with business intelligence tools which can help you visualize your data in a clear and meaningful way. These tools allow you to create charts, graphs, and other visual aids that can help you understand your data and make informed business decisions.
- Compatible with all versions of Excel: Our templates are compatible with all versions of Excel, so you can use them regardless of what version you have.
- Customer support: We also offer customer support to ensure that you can use our templates with ease. Whether you need help customizing a template or have a question about a specific feature, our customer support team is here to assist you.
- Variety of templates: We offer a wide variety of templates for various business needs such as financial analysis, project management, sales tracking, inventory management and more.
In summary, using editable Excel templates for data analysis can save you time and effort, while providing professional design, customizable options, business intelligence tools, compatibility, customer support, and variety of templates to choose from.
Download Income Statement Chart excel template and use it
Using this editable Income Statement Chart Excel templates for data analysis is easy. Here are the steps to download and use one of our templates:- Login and subscribe to our website : To access our templates, you'll need to first login and subscribe to our website. This will give you access to our entire collection of templates.
- Click on the download button: Once you've subscribed, browse through our collection of templates and find the one that best fits your needs. When you've found the template you want, click on the download button.
- Feed in actual data: Once the template is downloaded, open it in Excel. You'll see that it is already set up with sample data. To start analyzing your own data, simply replace the sample data with your actual data.
- Customize the template: Our templates are completely editable, which means you can customize them to fit your specific needs. For example, you can change the formatting, add or remove columns, or create new charts and graphs.
- Use the Excel template: Once you've fed in your data and customized the template, you're ready to start using it for data analysis. Use the various tools and features of Excel to analyze and visualize your data, and make informed business decisions.
- Save and share the template: Once you've finished working on the template, save it to your computer and share it with other members of your team or stakeholders as needed.