
About Budget vs Actual Variance Analysis Report
Understanding the Differences between Your Budget and Reality!
Budgeting is an essential part of any business or organization, as it helps to determine future financial performance and ensure financial stability. However, no matter how accurately a budget is created, there is always the potential for differences between actual results and budgeted expectations. This difference between the budget and actual results is known as the budget variance.
The purpose of a Budget vs Actual Variance Analysis Report is to compare the budgeted figures with actual figures and determine the reasons for any variances. This report provides valuable insight into the financial performance of a company, and helps to identify areas where improvements can be made.
Components of a Budget vs Actual Variance Analysis Report
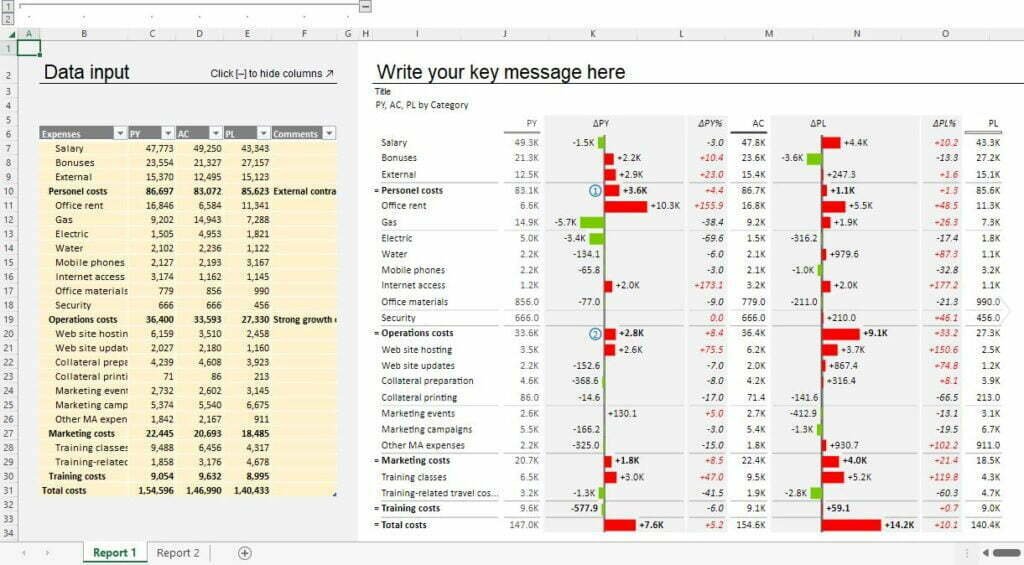
A Budget vs Actual Variance Analysis Report typically includes the following components:
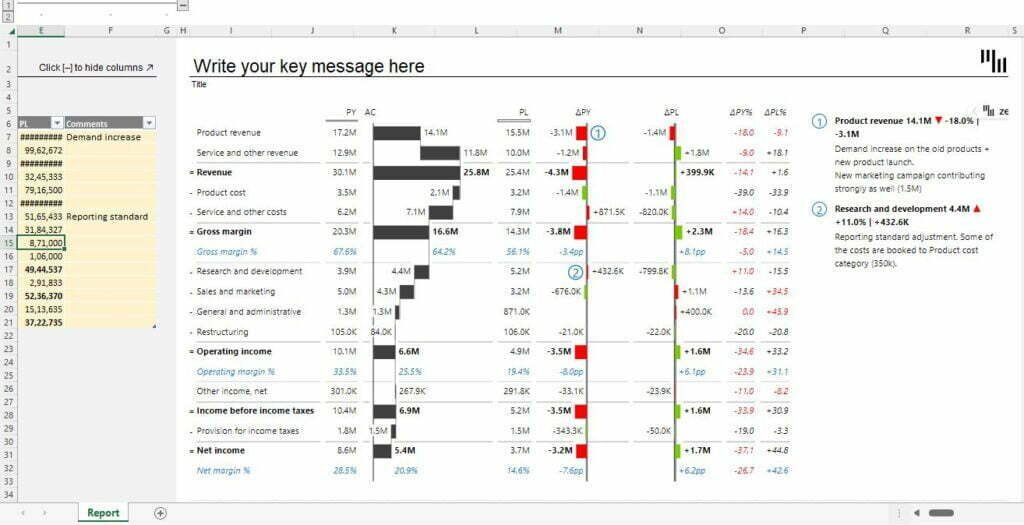
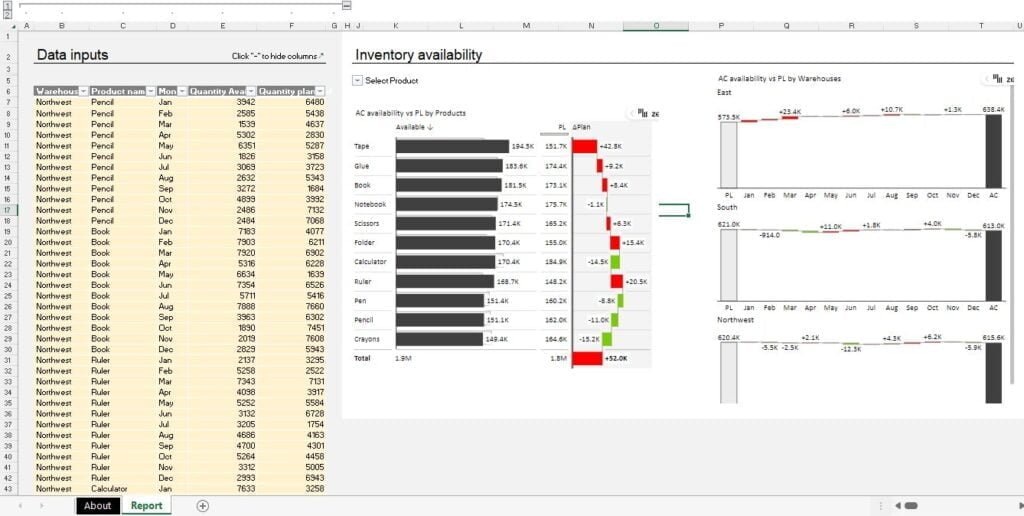
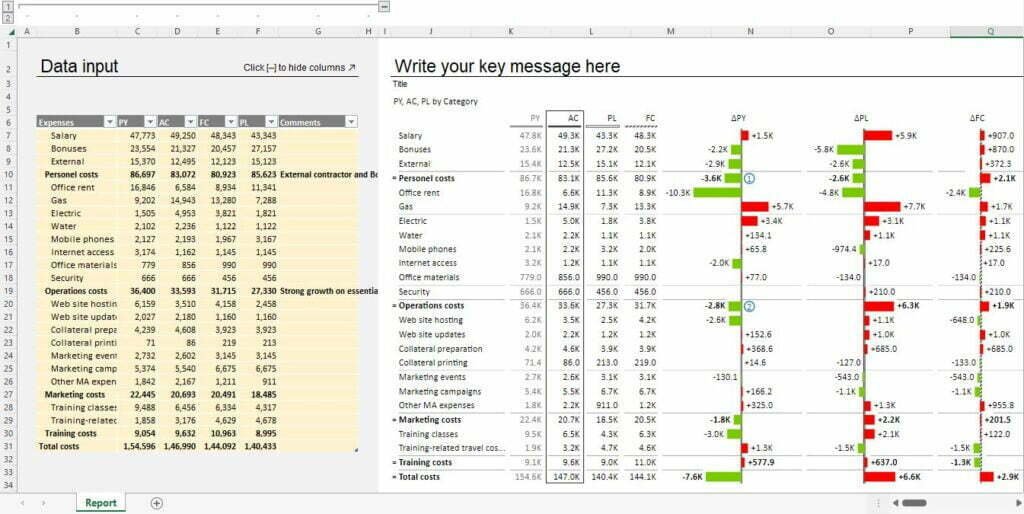
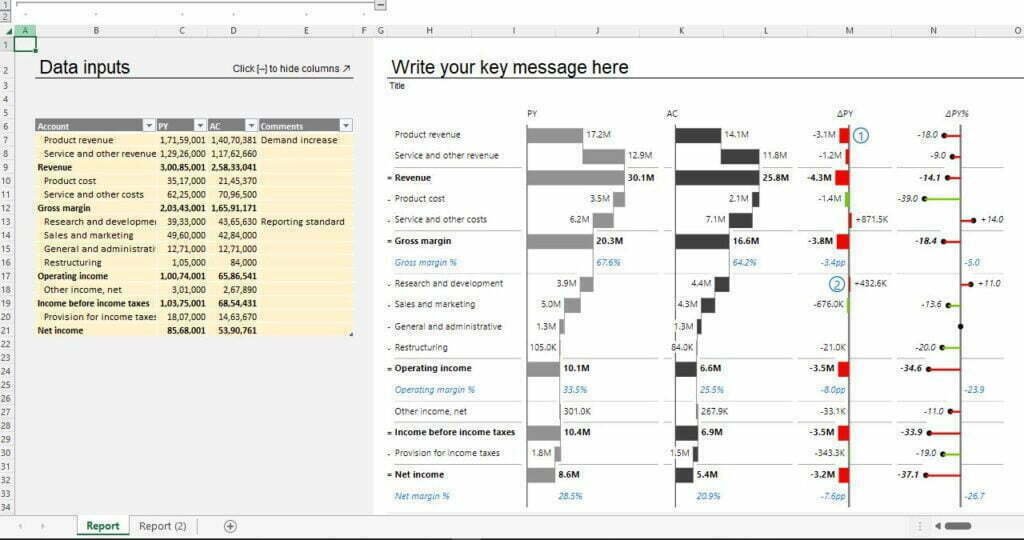
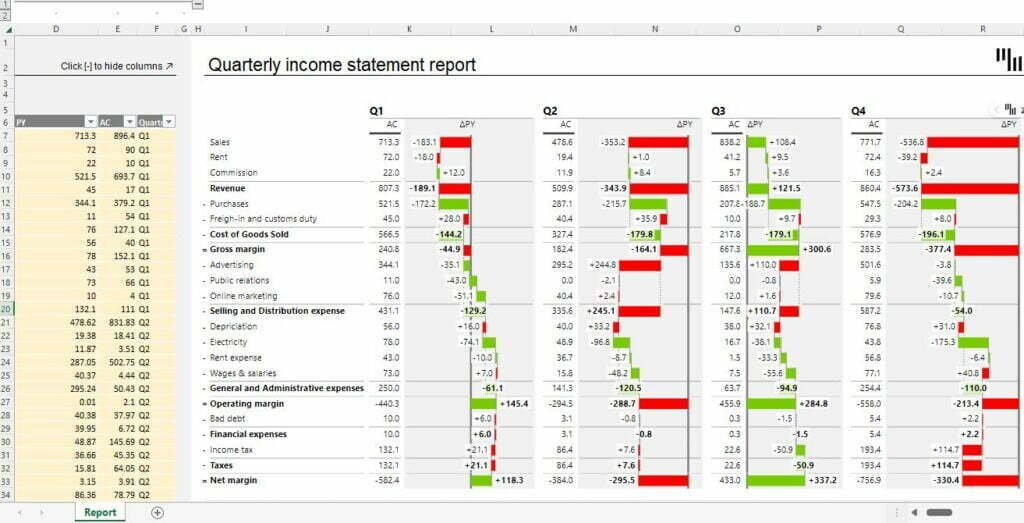
- Budgeted figures: This section includes the budgeted figures for each category, such as revenue, expenses, and capital expenditures.
- Actual figures: This section includes the actual figures for each category, as recorded in the accounting records.
- Variance: This section calculates the difference between the budgeted and actual figures and represents it as a percentage or dollar amount.
- Explanation: This section provides an explanation of the reasons behind the variances, including any unexpected changes in market conditions, changes in business operations, or errors in budgeting.
- Recommendations: This section includes recommendations for reducing the variance and improving the accuracy of budgeting in the future.
Benefits of a Budget vs Actual Variance Analysis Report
- Improved budget accuracy: By comparing the budgeted figures with actual results, the Budget vs Actual Variance Analysis Report helps to identify areas where the budget may be improved in the future. This leads to more accurate budgeting and better financial performance.
- Increased transparency: This report provides an open and transparent view of the financial performance of the company, allowing stakeholders to see exactly where their money is going and how it is being used.
- Improved decision making: The Budget vs Actual Variance Analysis Report provides valuable information that can be used to make informed decisions about future investments, expenditures, and operations.
- Better financial management: The Budget vs Actual Variance Analysis Report helps managers to identify areas where they can reduce costs, increase efficiency, and improve overall financial performance.
In conclusion, a Budget vs Actual Variance Analysis Report is an essential tool for any business or organization looking to improve its financial performance. By comparing the budgeted figures with actual results, this report helps to identify areas for improvement and provide valuable insights into the financial health of the company.
Benefits of using this editable Budget vs Actual Variance Analysis Report excel template
There are several benefits to using editable Budget vs Actual Variance Analysis Report Excel templates for data analysis:- Time-saving: Creating templates from scratch can be time-consuming and tedious. Using pre-designed templates can save you a significant amount of time and effort, allowing you to focus on analyzing your data.
- Professional design: Our templates are designed by professional designers who understand the importance of functionality and aesthetics. This ensures that your data is presented in a clear and professional manner.
- Customizable: All of our templates are completely editable, meaning you can customize them to fit your specific needs. This allows you to tailor the template to your unique requirements and make it more effective for your specific use case.
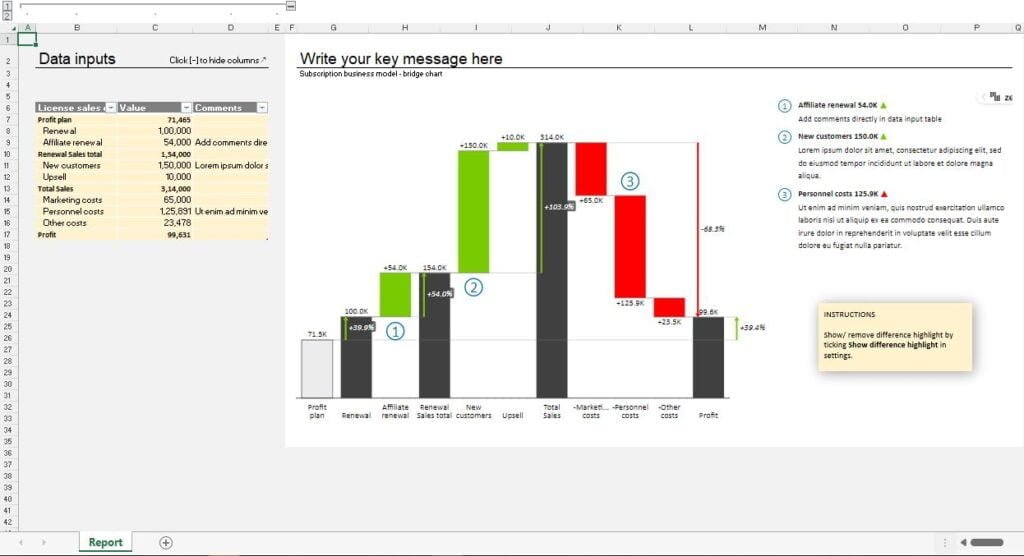
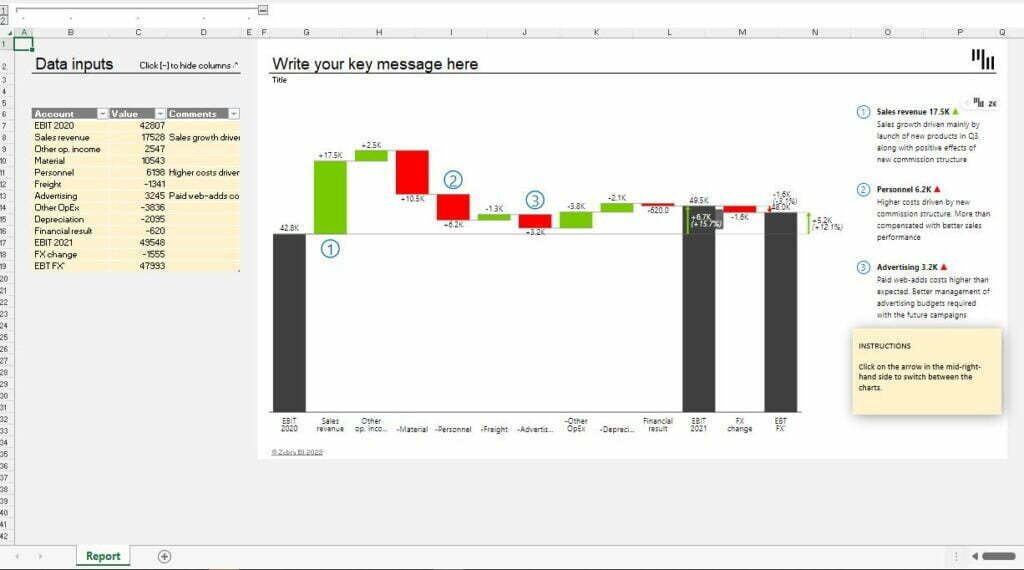
- Business intelligence tools: Our templates are prepared with business intelligence tools which can help you visualize your data in a clear and meaningful way. These tools allow you to create charts, graphs, and other visual aids that can help you understand your data and make informed business decisions.
- Compatible with all versions of Excel: Our templates are compatible with all versions of Excel, so you can use them regardless of what version you have.
- Customer support: We also offer customer support to ensure that you can use our templates with ease. Whether you need help customizing a template or have a question about a specific feature, our customer support team is here to assist you.
- Variety of templates: We offer a wide variety of templates for various business needs such as financial analysis, project management, sales tracking, inventory management and more.
In summary, using editable Excel templates for data analysis can save you time and effort, while providing professional design, customizable options, business intelligence tools, compatibility, customer support, and variety of templates to choose from.
Download Budget vs Actual Variance Analysis Report excel template and use it
Using this editable Budget vs Actual Variance Analysis Report Excel templates for data analysis is easy. Here are the steps to download and use one of our templates:- Login and subscribe to our website : To access our templates, you'll need to first login and subscribe to our website. This will give you access to our entire collection of templates.
- Click on the download button: Once you've subscribed, browse through our collection of templates and find the one that best fits your needs. When you've found the template you want, click on the download button.
- Feed in actual data: Once the template is downloaded, open it in Excel. You'll see that it is already set up with sample data. To start analyzing your own data, simply replace the sample data with your actual data.
- Customize the template: Our templates are completely editable, which means you can customize them to fit your specific needs. For example, you can change the formatting, add or remove columns, or create new charts and graphs.
- Use the Excel template: Once you've fed in your data and customized the template, you're ready to start using it for data analysis. Use the various tools and features of Excel to analyze and visualize your data, and make informed business decisions.
- Save and share the template: Once you've finished working on the template, save it to your computer and share it with other members of your team or stakeholders as needed.